How to Optimize Your Prices to Increase Subscription Revenues
Many subscription companies simply set a price and start selling their products ASAP. That’s great when it comes to getting an MVP out the door — but it can also leave a lot of money on the table.
Whether it’s price plans that let you charge more for more features or lower-priced plans that can prevent voluntary churn, there’s a lot to experiment with. Along with reducing involuntary churn, tweaking your pricing is another area that can produce tremendous returns.
Successful companies like Buffer have taken seemingly-drastic steps towards price optimization in the past. At the 2016 SaaStr Conference, Buffer co-founder Leo Widrich spoke of their decision to double Buffer’s pricing. They had no idea what would happen, but they were confident that they’d made a great product and were creating value for their users.
In the end, the risk paid off for Buffer. They had doubled their prices. There was a huge impact on revenue and profitability, with little to no impact on conversion or retention.
In a similar test, Server Density originally had their pricing on a per-server basis, at $13/server. They wanted to see if they could increase their revenue, so they changed their pricing to be in bundled packages of $99, $299, or $499 a month. The $99/month package covered up to 10 servers, so it lowered the price from the $13/server price, but with the intention of increasing their average order value. As a result, they had a 114% increase in revenue — despite previously having customers complain about their prices.
The moral of these stories: If you aren’t experimenting with your prices early and often, you could be missing out
Price optimization can be broken down into three distinct stages:
- Acquisition
- Growth
- Retention

The most profitable subscription businesses are always running pricing experiments and looking for better performance. (Yes, even when their numbers are already pretty good.) Here’s how to get started:
Step One: Set a goal
The first step of every pricing experiment is to set a measurable goal. An example would be “increase conversion by x%.” Keep it simple, and make sure you choose a goal based on what matters most to your particular business.
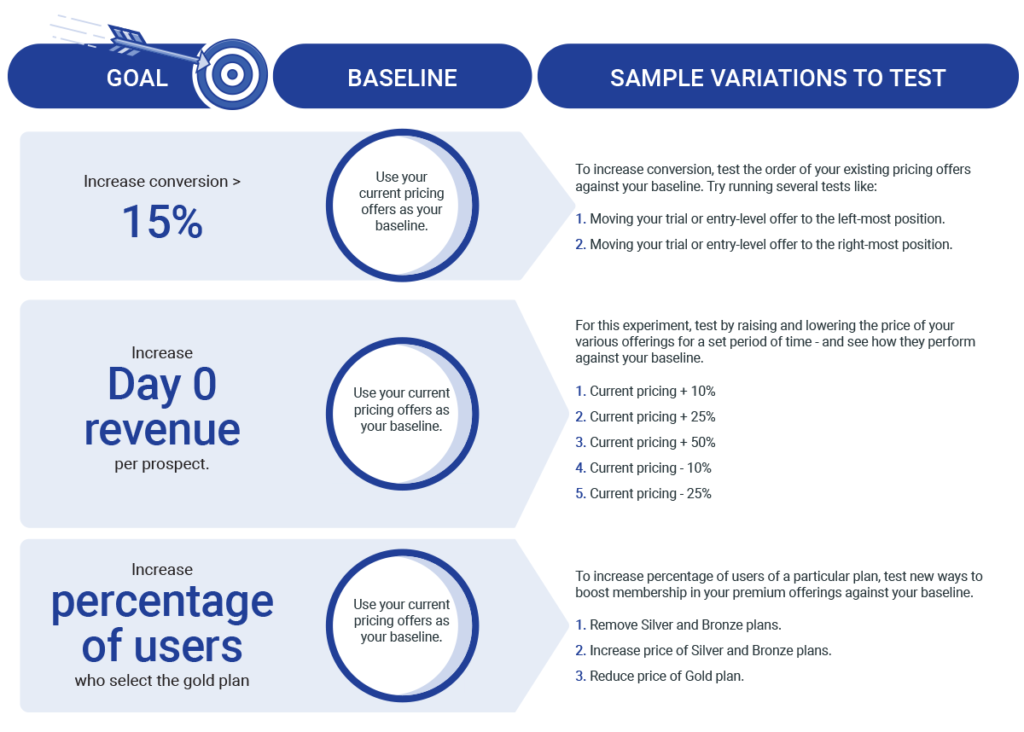
A great place to start is by experimenting with different pricing offers to prospects. Here are a few example starter goals and their corresponding experiments:

Step Two: Set up your experiments
You might have been following along thus far and wondering — all of this sounds great, but how do I actually set these up?
If you’re looking for tools that will work regardless of platform, Google Optimize, Optimizely, or VWO are great places to start. If you’re fairly tech-savvy, familiar with Google Analytics, and want to get started for free, Google Optimize is your best bet. Optimizely and VWO both offer a variety of plans and features, but you have to get in touch with their sales teams to get exact prices.
Tools that integrate work WordPress:
WordPress is still the most popular CMS out there, so if you’re using it and want some tools that come with ready-made integrations, you might take a look at Thrive Optimize. It’s part of the Thrive Themes suite of apps and installs as a plugin. With it, you can get detailed reporting, distribute traffic in custom percentages, and set conversion goals based on opt-ins, revenue, or visits. Prices start at $19/month for a Thrive membership or $127 for a license.
Another WordPress-integrated option is the Nelio A/B Testing plugin, which starts at $29/month. In addition to standard testing features, it includes features like heat maps, click maps, and testing variations on child themes.
Step Three: Get enough data to have accurate results
Once you’ve set up an experiment, you need to make sure it reaches statistical validity before making any conclusions about the results. The gist of “statistical validity” is that you need to make sure that you:
- Have enough participants in the test to make sure that each participant isn’t a disproportionate amount of the results
- Have a large enough difference in the test results for it to be relevant
Most testing tools will calculate this for you, but if not, you can use Neil Patel’s calculator to get a quick idea of whether your test is statistically valid. There’s also the Optimizely sample size calculator to get an idea for how large your sample size should be. If you want to read more about the math behind this, VWO has a great breakdown on their blog.
Step Four: Assess your results
You’ve reached statistical validity! It’s time to take a look at the results and see which pricing model (or copy, or pricing plan, etc.) performed better. Here are a few things to keep in mind:
Don’t infer more than is strictly necessary. Our brains love to turn anything into a story, which can be great when we’re improvising a reason that we forgot our homework, but less great when analyzing experiment results. The temptation is often to say, “XYZ performed better than ABC, probably because…” The problem is that unless you were able to interview every single participant in the test after they made their decision, you don’t actually know why they made that decision. This is especially true when it comes to subscription purchases, which often have different motivations than one-time purchases.
The best you can do is make a hypothesis, and then create other tests to try and test that hypothesis. Another option is to conduct extensive user interviews to figure out why users made the decisions they did. The problem with assuming things about the results is that your assumption might be wrong. Then, in turn, whatever decisions you make based on that assumption could also be wrong. It can create a domino effect of wrong assumptions/decisions, and it’s the opposite of methodical, data-based testing.
Make sure to look at long-term results. As we’ve written about before, making decisions based off of just a conversion rate, without looking at the longer-term results (like average customer value or estimated lifetime value), can be shortsighted. You don’t have to wait 3-6 months to draw initial conclusions, but make sure that you’re tracking which customers came through which experiment. That way, a few months or a year down the line, you can see the long-term results, and iterate off of those.
Step Five: Choose your next experiment
You’ve successfully run your first experiment, you’ve reached statistical validity, and you’ve figured out how to get more revenue. Congratulations!
What’s next? Go back to the drawing board and choose your next test. You don’t have to be running major tests all the time, but you can be testing the order plans are listed, what kind of pricing formulas you’re using, the calls to action, how your prices & features are displayed, etc. The only thing you can do is improve your current results, so why not test everything?
Looking to hit the ground running with your first experiment? Our price optimization guide has a list of experiments you can do right now, categorized by funnel stage and difficulty. You can download it now and get started today:
